
1 | 2 | 3 |
4 | 5 | 6 |
7 | 8 | 9 |
0 |
|
|
|||
|
|
|||
|
|
|
Get Rich |

|
Die Broke |
| Starting Balance |
Year End Deposits |
Year End Earnings |
Paid For Taxes |
Paid For Retirement |
|---|

|
Experiment With The Two Demo Example Plans
TapClick the menu icon at top left to show the side-bar menu for choices of demo example plans.
You can change the demo plan's data entry values to experment. When you leave a demo plan, the original demo data entry values are restored.
The User Interface
Swipe the data window up and down to scroll.
Drag the charts left and right to pan, or select one of the pagination dots to show that chart.
A Note About The Charts
Chart bars are not drawn to scale, but are sized logarithmically proportional to their value. The actual values are shown in the accompanying data table. To see which chart bar corresponds to a particular year in the data table, just tapclick that year in the table and the corresponding chart bar will pulse.
Slide the chart page's rate sliders to interactively change the charts to show the effect of rate changes. These rate changes are temporary, used only for these interactive tests, and are not permanently saved in your plan's data.
Privacy Of Your Data
This program respects your privacy. The information that you enter here is kept in your own device only. It is not disclosed to any other person or organization. This program saves your information locally for use the next time you use this program.
If you have any concern with others using your device, you can use the side-bar menu to select the Clear Data option. This will remove all the data you entered for your plan. Data for the demo plans are not effected.
Another option is to use the side-bar menu and select Set PIN. You can then enter a 4 digit PIN to block access to this program without first entering the PIN. Once you have entered your PIN you have access to this program with your data. Then you can change your PIN anytime by selecting the Set PIN menu choice. If you select the Set PIN menu choice and then exit the program without entering digits, you clear the PIN requirement. If you clear your data, your PIN requirement is cleared also.
Comments
Please send comments, suggestions, and bug reports using the side-bar's Comment menu choice.
Green Demo Charts
TapClick a demo chart image to enlarge it. Then grab and drag the top bar to move it.
This section explains the actual charts you will see if you use the green demo with its default values and go to see the Interactive Money Charts. The demo shows the couple's planning as it was prepared in 2013 to project out for a life span of 99 years. The projection uses assumptions and account values entered at that time.
This is a live demo. You can experiment and change the values to see the resulting charts. The values are reset to their initial values when you exit the demo.
Chart bars are not drawn to scale, but are sized logarithmically proportional to their value. This allows you to see trends in each category without the large account values overwhelming the small ones graphically. The actual values are shown in the accompanying table. Actual values can also be seen if you touch and hold on a bar segment, as shown below.
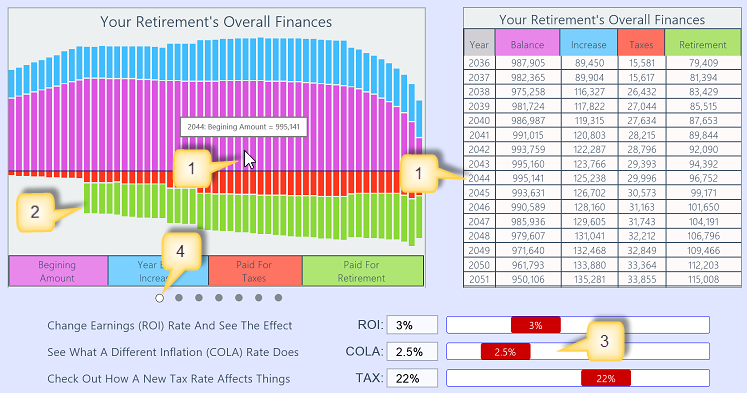
The pop up shown only works with a mouse pointer (sorry). But when you tap any year in the data table, the corresponding chart bar will pulse to show you its location. When you rest your cursor over a bar segment, the year, and value will show in a pop-up. The same data for the year (2044) is shown in the table on the right side.
The year 2023 is the first year of retirement. Money is now drawn from accounts to finance the retirement living expenses. The details of the money drawn from each account are shown on the other charts.
These sliders let you experiment by changing the assumed value for earnings, inflation, and taxes. The program will recalculate your finances with the new value and show the result in the chart and table. These experimental changes do not update the values entered in the data entry page. You can reset your charts by going back the the start page, then tappingclicking the charts button again.
The dots here are pagination indicators for the calculated charts. They show which chart of the group is currently shown. You can swipe your finger on the charts to slide them left or right. You can also tapclick any dot to move directly to that chart.
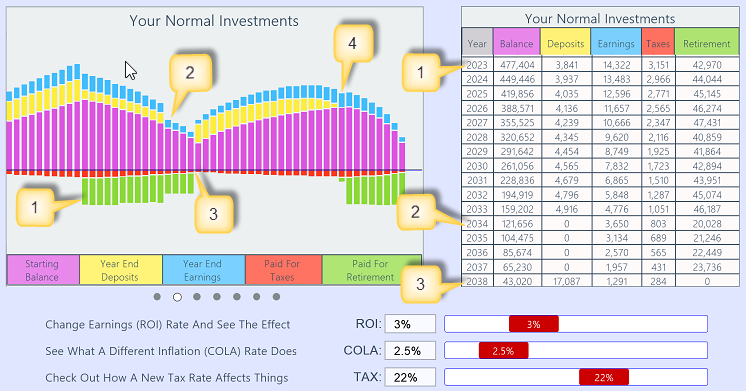
This is an interesting chart showing an effect of a large IRA. A large IRA can happen, for example, as the result of a rollover from a past employer's beneficial profit sharing plan.
Retirement payouts start with first person's retirement in year 2023. The first person to retire stops depositing into the taxable account. The second person's savings are still deposited into the taxable account until that person also retires.
The second person retires in year 2034 and stops depositing into the taxable account.
The second person reaches 70 1/2 years old in year 2038 and must take Required Minimum Distributions from IRA. That IRA is large and the distribution is more than is needed for retirement living expenses, so the excess amount is deposited into the taxable account. No money needs to be withdrawn from the taxable account.
The large IRA has been reduced by year 2057 so that the required distribution is not enough to cover the retirement living expenses. The money needed to make up the balance of the retirement living expenses is again taken from the taxable account. The money needed is not taken from the IRA, but is kept in the IRA where it earns tax deferred profits to maximize your earning efficiency. No more deposits are made into the taxable account.
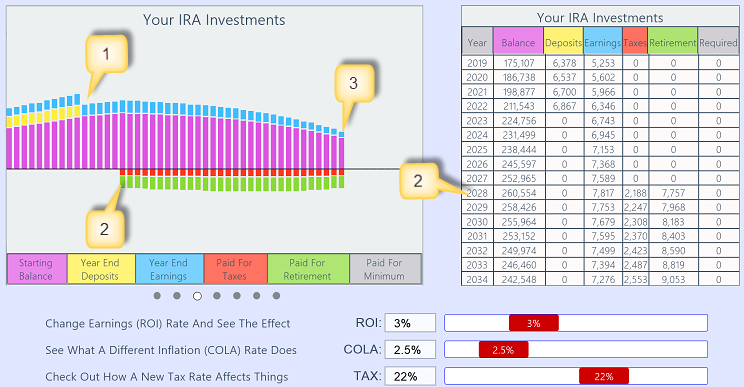
You retire in year 2023 and stop making deposits into your IRA.
You reach age 70 1/2 in year 2028 and start taking Required Minimum Distributions from your IRA. These are used to contribute to the needed retirement living expenses.
When you die in year 2057, your spouse inherits your IRA account balance.
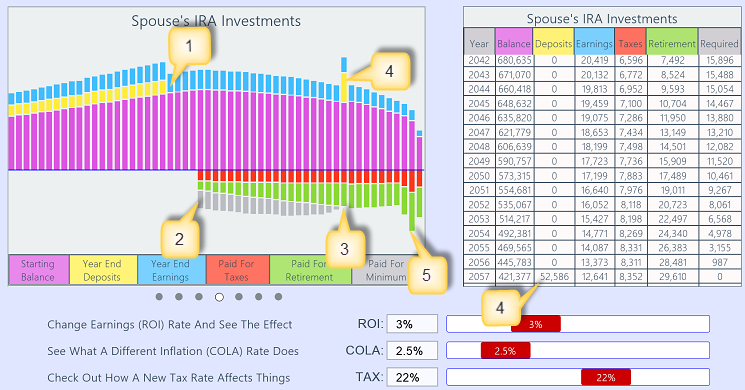
Your spouse retires in year 2034 and stops making deposits into her IRA.
Your spouse reaches age 70 1/2 in year 2038 and starts taking Required Minimum Distributions from the IRA. The distribution is more than enough to cover the balance of funds needed for retirement living expenses, so the excess (shown in grey) is deposited in the taxable account.
The IRA account balance has been reduced so that the RMD from the account is not large enough to cover the balance of funds needed for retirement living expenses, so the taxable account begins to provide funds again.
When you die in year 2057, your spouse inherits your IRA account balance, without tax consequences.
The taxable account runs out of money in 2065, so in years 2065, 2066, and 2067, your spouse's IRA solely supplements the pension and social security payments to cover the balance of funds needed for retirement living expenses. The IRA is depleted the year your spouse dies in 2067.
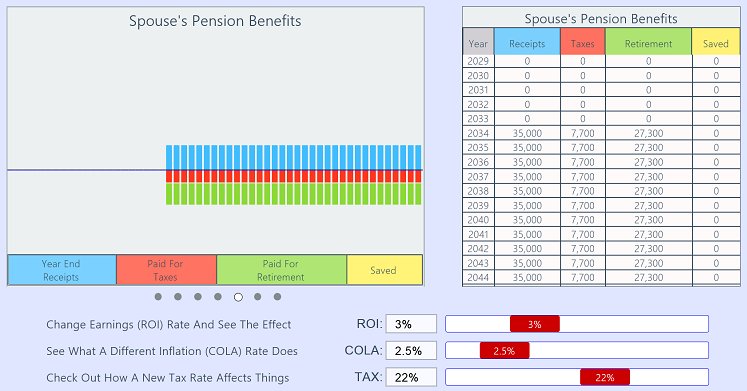
Your spouse's pension plan payments are not indexed, and so continue to deliver fixed payments for life.
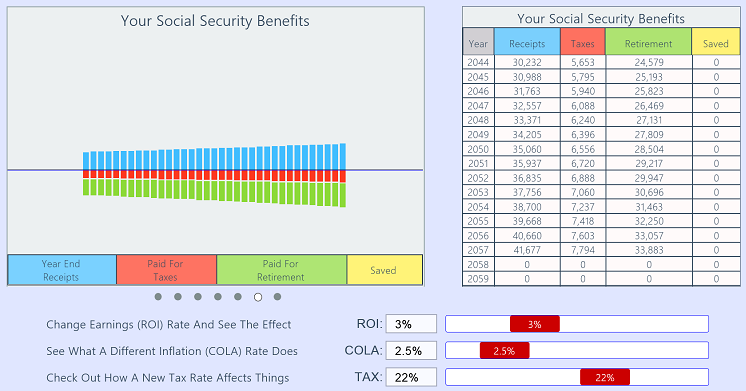
Your social security payments are indexed for inflation, and continue to deliver adjusted payments for life.
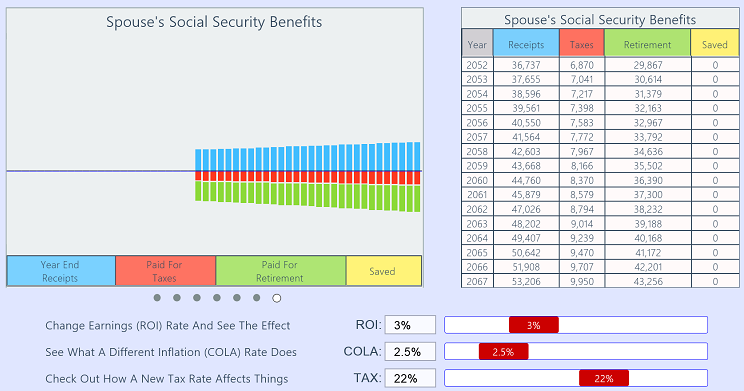
Your spouse's social security payments are indexed for inflation, and continue to deliver adjusted payments for life.
Red Demo Charts
TapClick a demo chart image to enlarge it. Then grab and drag the top bar to move it.
This section explains the actual charts you will see if you use the red demo with its default values and go to see the Interactive Money Charts. The demo shows the couples' planning as it was prepared in 2013 to project out for a life span of 99 years. The projection uses assumptions and account values entered at that time.
This is a live demo. You can experiment and change the values to see the resulting charts. The values are reset to their initial values when you exit the demo.
Chart bars are not drawn to scale, but are sized logarithmically proportional to their value. This allows you to see trends in each category without the large account values overwhelming the small ones graphically. The actual values are shown in the accompanying table. Actual values can also be seen if you touch and hold on a bar segment, as shown below.
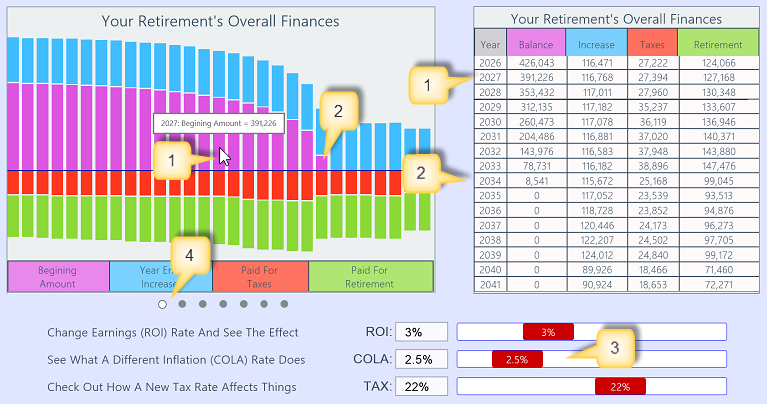
The pop up shown only works with a mouse pointer (sorry). But when you tap any year in the data table, the corresponding chart bar will pulse to show you its location. When you rest your cursor over a bar segment, the year, and value will show in a pop-up. The same data for the year (2044) is shown in the table on the right side.
The year 2034 is the last one with a beginning balance in any asset account. Retirement funding now is from pensions and social security payments.
These sliders let you experiment by changing the assumed value for earnings, inflation, and taxes. The program will recalculate your finances with the new value and show the result in the chart and table. These experimental changes do not update the values entered in the data entry page. You can reset your charts by going back the the start page, then tappingclicking the charts button again.
The dots here are pagination indicators for the calculated charts. They show which chart of the group is currently shown. You can swipe your finger on the charts to slide them left or right. You can also tapclick any dot to move directly to that chart.
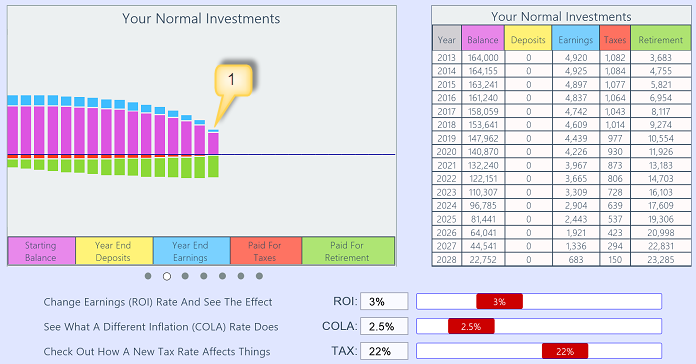
The taxable asset accounts run out of money in 2028. During the years from 2013 both IRA accounts have had Minimum Required Distributions withdrawn, and pension and social security payments were received. Those were not enough to fund the total retirement living expenses, so money was withdrawn out of the taxable accounts to make up the balance. Now withdrawals from the IRA accounts will have to increase to fund the entire amount needed for retirement living expenses.
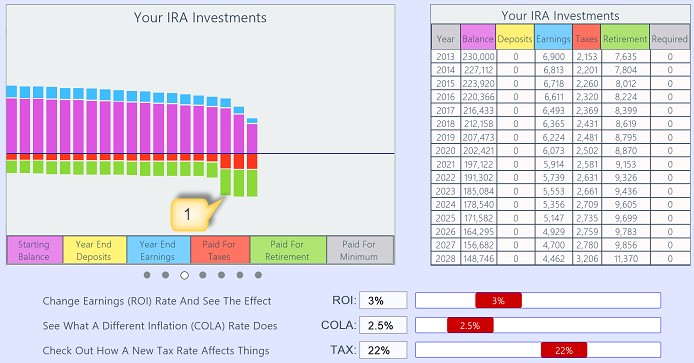
During the three years starting in 2029 your IRA had more than the Minimum Required Distributions withdrawn to help fund the total retirement living expenses. Your IRA accounts run out of money in 2031. Now withdrawals from your spouse's IRA accounts will increase to make up the balance to fund the entire amount needed for retirement living expenses.
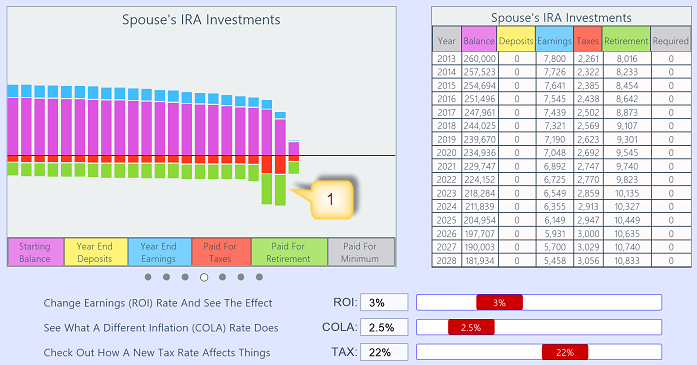
For the years 2032 and 2033 your spouse's IRA had more than the Minimum Required Distributions withdrawn to make up the balance to fund the total retirement living expenses. This IRA account ran out of money in 2034, and the total of receipts from pension and social security payments are all that remain to fund retirement living expenses. This is less than you have specified, but at year 2034 you are 94 and your spouse is 92. This projection is so far into the future as to be meaningless, except to show how important it is that you keep revising this plan yearly to keep your financial status current to ensure having enough money at this age.
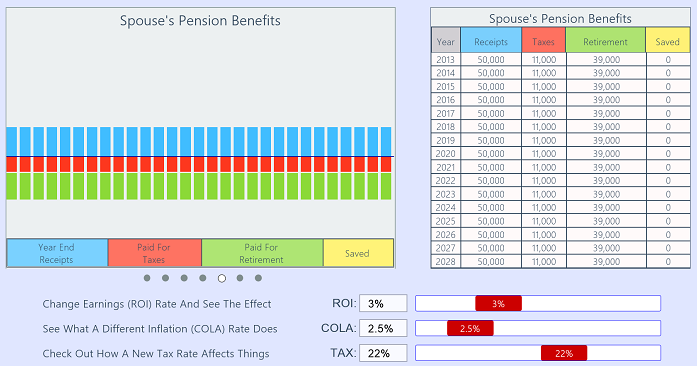
Your spouse's pension plan payments are not indexed, and so continue to deliver fixed payments for life.
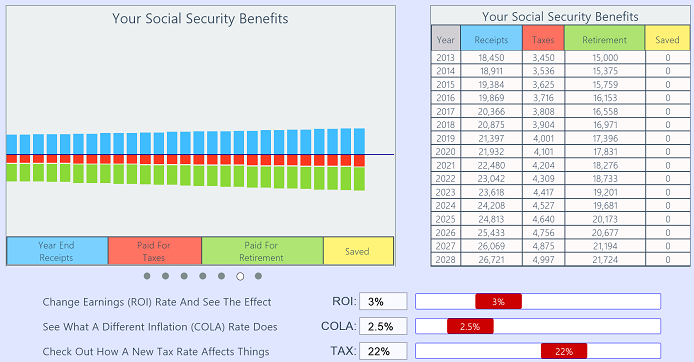
Your social security payments are indexed for inflation, and continue to deliver adjusted payments for life.
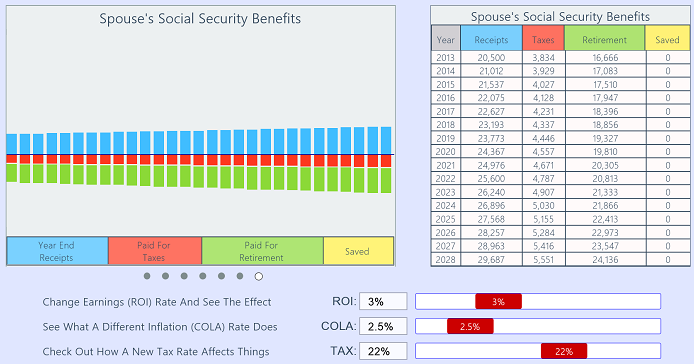
Your spouse's social security payments are indexed for inflation, and continue to deliver adjusted payments for life.